Firewall
How Stuff Works
Wikipedia
Zonealarm
Comodo
Man-in-the-middle Attack
Wikipedia
ARP spoofing
DNS Poisoning
DNS Poisoning Video
Cookies
Wikipedia
Sidejacking
Gmail https
Gmail Activity
Tor
Wikipedia
Tor Website
Proxy
Wireless (Wifi)
Wired Equivalent Privacy (WEP)
Wi-Fi Protected Access
Airbase
Airsnort
Kismet
Ettercap
Top 100 Security Tools
Radio-frequency identification
Wikipedia
The Risk of ePassports and RFID
Elvis' RFID Passport
RFID reader
How To: Disable Your Passport's RFID Chip
How to Disable RFID tags
Sunday, October 26, 2008
Monday, October 20, 2008
Wireshark lab: 10/22
You will use the following three files for the labs:
rhino.log
rhino2.log
rhino3.log
Download each of these trace files to use with wireshark. For each of these network trace files do the following:
1) Look at the protocol column and write down each unique protocol that you see there.
2) Briefly describe 5 of the protocols from (1) - that is, what do they do/what are they used for? (We have covered a few protocols in class).
3) Use the search bar to see if you can find any image files. Image files often have file headers of JFIF, EXIF or GIF.
4) If you find any image files, write down the IP addresses that are involved in transmitting those files.
Saturday, October 11, 2008
Wireshark lab: 10/15
As I wrote earlier, you will have labs on Wed 10/15 and Wed 10/22 in lab 4206N.
You will use the following trace files since you cannot do live capture in the lab.
After you have downloaded the above zip file, extract the contents onto the desktop.
You will do a lab on HTTP. The lab says ``Ethereal'' which is the old name for Wireshark, but the lab is still valid.
Start up Wireshark and open the file called http-ethereal-trace-1 that you extracted onto the desktop by choosing File->Open and then choosing the above file. You will use this file for all of part 1 in the HTTP lab. Each section uses a different trace file read carefully which trace file you need to use (each of the http-ethereal-trace files will be used).
Try to answer as many questions as you can. These will be figured into your grade as extra credit.
Monday, October 6, 2008
Network Tools
Just to recap, here is a list of tools that we have been using for network forensics:
Chaosreader
Chaosreader can extract images from the network log files (though not all as we saw) and will print out a nice html report of all the flows.
Here is Chaosreader in action:
Full Screen
It can provide a nice start for making sense of the log file and locating connections of interest. However it doesn't extract all files of interest.
Etherape
Etherape allows you to see the traffic as a graphical representation. You can have it listen on a live device, or you can feed it a network dump file. Here is a video of etherape:
Full Screen
p0f
p0f is a passive OS identification tool. It uses three tests:
1) SYN packet test, where it watches outgoing SYN packets
2) Using the -A switch enables the SYN+ACK test
3) Using the -R switch enables the RST+ACK test
You can have it run on an interface by using the -i switch and interface name, or against a dump file using the -s flag.
snort
Snort is an intrusion detection system, but can also be used to read files. You have been supplied with alert files that were created by snort against the dump files given to you. When running snort you can use flags to make it read in a file. Here are the flags that were used to create the alert files:
A brief snort video:
Full Screen
tcpdump
Tcpdump can be used to capture network traffic. When doing so, you let tcpdump know which device to use to read packets using the -i switch. If you want to save the traffic, you can use the -w switch. You can also specify the size of each packet saved by using the -s switch. Here is an example usage:
Tcpdump can also be used to read traffic data from a network dump file by using the -r switch followed by the name of the file you want to read. Here are some other switches you should use:
One can also specify other items for tcpdump to look for in the traffic. Here is a TCP header:

With all TCP traffic there are flags that are associated with the conversation. Here are some flags of interest:
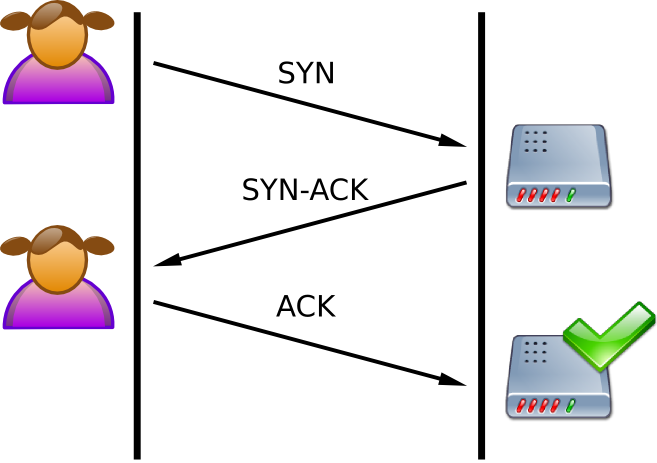
When a TCP connection is first made, there is a 3-way handshake that must occur before data can be sent. The handshake consists of:
1) A SYN packet sent to the server from the client
2) Response of SYN-ACK from the server
3) An ACK sent back to the server from the client
Seen below:

Therefore, one is often interested in SYN packets and can search for them using tcpdump. If you look at the TCP header you can see that the flags are located in the thirteenth byte. Therefore we can tell tcpdump to look in the thirteenth byte and give it the value. Since the SYN flag is the second one from the right, it has a value of 2 (think binary). So one usage is:
If you want to see packets with the SYN flag (and other flags) set you have to use bitwise AND:
Likewise SYN+ACK has a value of 18, since the ACK flag is in location 4 (zero based) from the right which has a value of 16 and since SYN has a value of 2, we can change the total value to 18:
Or Hex:
You can also use the tcpflags option:
You can also indicate a particular host:
tcpxtract
Tcpxtract can be used to extract files from network dumps. We found that it crashed on some dumps with a segmentation fault however while we were doing our analysis.
tcpflow
Tcpflow is a really nice tool that can be used to rebuild conversations between two machines. Therefore we can use it to extract files. Here is a basic usage:
The -r switch works as before to indicate which file to read. The -c flag says put output to stdout. The port option lets one indicate which port number to use to construct a stream.
Here is a video of tcpflow being used to extract a JPEG file after finding it with chaosreader:
Full Screen
Therefore, if you have a lot of ftp connections, you can extract all files from the streams by using port 20 in the tcpflow command. Why port 20? Because an ftp connection uses two ports: 20 and 21. Port 21 is the control/command port (the connection all your typed commands go to) and port 20 is the data connection where the files get uploaded. You can use it on Venus, just issue the following commands:
The executable will be in the

Wireshark et al.
You have been using wireshark for a while now. I will continue writing about it a bit later...
Full Screen
Chaosreader
Chaosreader can extract images from the network log files (though not all as we saw) and will print out a nice html report of all the flows.
Here is Chaosreader in action:
Full Screen
It can provide a nice start for making sense of the log file and locating connections of interest. However it doesn't extract all files of interest.
Etherape
Etherape allows you to see the traffic as a graphical representation. You can have it listen on a live device, or you can feed it a network dump file. Here is a video of etherape:
Full Screen
p0f
p0f is a passive OS identification tool. It uses three tests:
1) SYN packet test, where it watches outgoing SYN packets
2) Using the -A switch enables the SYN+ACK test
3) Using the -R switch enables the RST+ACK test
You can have it run on an interface by using the -i switch and interface name, or against a dump file using the -s flag.
snort
Snort is an intrusion detection system, but can also be used to read files. You have been supplied with alert files that were created by snort against the dump files given to you. When running snort you can use flags to make it read in a file. Here are the flags that were used to create the alert files:
# snort -c [config_file] -r [dump_file] -l [directory]

-c lets snort know which configuration to use
-r lets snort know which file to read
-l lets snort know where to write the log files
A brief snort video:
Full Screen
tcpdump
Tcpdump can be used to capture network traffic. When doing so, you let tcpdump know which device to use to read packets using the -i switch. If you want to save the traffic, you can use the -w switch. You can also specify the size of each packet saved by using the -s switch. Here is an example usage:
# tcpdump -i eth0 -s 1515 -w file.lpc
Tcpdump can also be used to read traffic data from a network dump file by using the -r switch followed by the name of the file you want to read. Here are some other switches you should use:
-n  used to get only IP numbers
-nn don't translate IP and port numbers
-x  used to get hex data of packets
-X  used to get hex and ASCII data of packets
-c  used to specify a number of packets
-e  used to get link layer headers (MAC addresses)
One can also specify other items for tcpdump to look for in the traffic. Here is a TCP header:

With all TCP traffic there are flags that are associated with the conversation. Here are some flags of interest:
- SYN – Synchronize sequence numbers
- ACK – indicates an ACKnowledgment
- PSH – Push function
- RST – Reset the connection
- FIN - close connection
When a TCP connection is first made, there is a 3-way handshake that must occur before data can be sent. The handshake consists of:
1) A SYN packet sent to the server from the client
2) Response of SYN-ACK from the server
3) An ACK sent back to the server from the client
Seen below:
Therefore, one is often interested in SYN packets and can search for them using tcpdump. If you look at the TCP header you can see that the flags are located in the thirteenth byte. Therefore we can tell tcpdump to look in the thirteenth byte and give it the value. Since the SYN flag is the second one from the right, it has a value of 2 (think binary). So one usage is:
$ tcpdump -n -r [file.lpc] 'tcp[13]==2'
If you want to see packets with the SYN flag (and other flags) set you have to use bitwise AND:
$ tcpdump -n -r [file.lpc] 'tcp[13] & 2 == 2'
Likewise SYN+ACK has a value of 18, since the ACK flag is in location 4 (zero based) from the right which has a value of 16 and since SYN has a value of 2, we can change the total value to 18:
$ tcpdump -n -r [file.lpc] 'tcp[13]==18'
Or Hex:
$ tcpdump -n -r [file.lpc] 'tcp[13]==0x12'
You can also use the tcpflags option:
$ tcpdump -n -r [file.lpc] 'tcp[tcpflags]==2'
You can also indicate a particular host:
$ tcpdump -n -r [file.lpc] 'tcp[13]==2' and host [IP]
tcpxtract
Tcpxtract can be used to extract files from network dumps. We found that it crashed on some dumps with a segmentation fault however while we were doing our analysis.
tcpflow
Tcpflow is a really nice tool that can be used to rebuild conversations between two machines. Therefore we can use it to extract files. Here is a basic usage:
$ tcpflow -r [file.lpc] -c port [port number]
The -r switch works as before to indicate which file to read. The -c flag says put output to stdout. The port option lets one indicate which port number to use to construct a stream.
Here is a video of tcpflow being used to extract a JPEG file after finding it with chaosreader:
Full Screen
Therefore, if you have a lot of ftp connections, you can extract all files from the streams by using port 20 in the tcpflow command. Why port 20? Because an ftp connection uses two ports: 20 and 21. Port 21 is the control/command port (the connection all your typed commands go to) and port 20 is the data connection where the files get uploaded. You can use it on Venus, just issue the following commands:
$ wget
  ftp://ftp.circlemud.org/pub/jelson/tcpflow/tcpflow-0.21.tar.gz
$ tar -xvzf tcpflow-0.21.tar.gz
$ cd tcpflow-0.21/
$ ./configure
$ make
The executable will be in the
tcpflow-0.21/srcfolder:

Wireshark et al.
You have been using wireshark for a while now. I will continue writing about it a bit later...
Full Screen
Friday, October 3, 2008
EC Homework
1) Download and install Wireshark.
2) Collect about 3-5 minutes worth of traffic on your computer. Surf as you would normally on your computer.
3) Stop collecting and save the file as ``network_home.pcap''
4) Look at the protocol column and write down each unique protocol that you see there.
5) Briefly describe 5 of the protocols from (4) - that is, what do they do/what are they used for? (We have covered a few protocols in class).
6) What is your IP address?
7) If you click on the Protocol column you can sort the packets by protocol. You can also search for a particular protocol by typing it in the ``Filter'' area. Filter for the HTTP protocol. Right click on one of the green HTTP lines and choose ``Follow TCP Stream.'' What does the first line of the pink text say? What does it mean? What does the first line of the blue text say and what is it mean?
Extras
Subscribe to:
Comments (Atom)